编程中设置了标题和图例,但显示不出来。
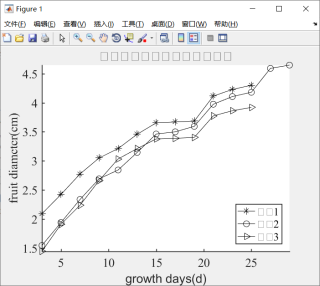
x=[3 2.092 1.548 1.446;5 2.424 1.942 1.912;7 2.776 2.338 2.238;9 3.05 2.692 2.662;...
11 3.212 2.844 3.034;13 3.458 3.146 3.212;15 3.654 3.462 3.378;17 3.67 3.5 3.388;...
19 3.684 3.594 3.404;21 4.114 3.974 3.774;23 4.228 4.106 3.862;25 4.3 4.18 3.92;...
27 NaN 4.59 NaN;29 NaN 4.646 NaN];
plot(x(:,1),x(:,2),'-*k',x(:,1),x(:,3),'-ok',x(:,1),x(:,4),'->k','MarkerSize',8);
axis([min(x(:,1)) max(x(:,1)) min(min(x(:,2:4))) max(max(x(:,2:4)))]);box off;
set(gca,'LineWidth',1,'FontSize',16,'FontName','Times');
xlabel('growth days(d)','FontSize',16,'FontName','Time');
ylabel('fruit diamctcr(cm)','FontSize',16,'FontName','Times');
title('番茄定株观测的果实直径动态');
legend('果实1','果粒2','果汁3','Location','SouthEast');
%我用的是matlab r2016a