m0_49298253 2023-05-26 20:55 采纳率: 0%
浏览 27

请问下大家可变形注意力怎么可视化热图

N, Len_q, _ = query.shape
N, Len_in, _ = input_flatten.shape
assert (input_spatial_shapes[:, 0] * input_spatial_shapes[:, 1]).sum() == Len_in

    value = self.value_proj(input_flatten)
    if input_padding_mask is not None:
        value = value.masked_fill(input_padding_mask[..., None], float(0))
    value = value.view(N, Len_in, self.n_heads, self.d_model // self.n_heads)
    sampling_offsets = self.sampling_offsets(query).view(N, Len_q, self.n_heads, self.n_levels, self.n_points, 2)
    attention_weights = self.attention_weights(query).view(N, Len_q, self.n_heads, self.n_levels * self.n_points)
    attention_weights = F.softmax(attention_weights, -1).view(N, Len_q, self.n_heads, self.n_levels, self.n_points)
    # N, Len_q, n_heads, n_levels, n_points, 2
    if reference_points.shape[-1] == 2:
        offset_normalizer = torch.stack([input_spatial_shapes[..., 1], input_spatial_shapes[..., 0]], -1)
        sampling_locations = reference_points[:, :, None, :, None, :] \
                             + sampling_offsets / offset_normalizer[None, None, None, :, None, :]
    elif reference_points.shape[-1] == 4:
        sampling_locations = reference_points[:, :, None, :, None, :2] \
                             + sampling_offsets / self.n_points * reference_points[:, :, None, :, None, 2:] * 0.5
    else:
        raise ValueError(
            'Last dim of reference_points must be 2 or 4, but get {} instead.'.format(reference_points.shape[-1]))
    output = MSDeformAttnFunction.apply(
        value, input_spatial_shapes, input_level_start_index, sampling_locations, attention_weights, self.im2col_step)
    output = self.output_proj(output)
    return output

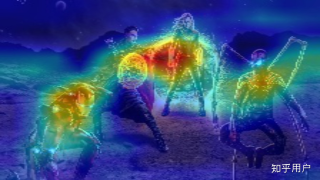
如上是可变形注意力的前传函数,请问下怎么可视化attention_weights形成如下效果,这个和detr好像不同

img

  • 写回答

2条回答 默认 最新

  • CSDN-Ada助手 CSDN-AI 官方账号 2023-05-27 08:10
    关注
    不知道你这个问题是否已经解决, 如果还没有解决的话:
    • 以下回答来自chatgpt:

      你好,很高兴能够帮助你解决可变形注意力可视化的问题。根据你的描述,我可以提供以下解决方案:

      1. 安装所需库:首先,你需要安装matplotlib库以展示热图。你也可以考虑安装seaborn库,它提供了更强大的可视化功能。你可以在命令行中输入以下命令:pip install matplotlib seaborn

      2. 提取attention_weights:为了展示热图,你需要先提取attention weights。通常,你的可变形注意力实现会返回一个[batch_size, num_heads, sequence_length, sequence_length]的张量,其中每个数字表示从第i个位置输出时,第j个位置的权重。

      3. 可视化热图:接下来,你可以通过将attention_weights绘制成热图来可视化它们。你可以使用matplotlib的imshow函数来实现绘图。代码如下:

      import matplotlib.pyplot as plt
      
      def plot_attention_weights(attention_weights):
          fig = plt.figure(figsize=(10, 10))
          ax = fig.add_subplot(1, 1, 1)
          ax.matshow(attention_weights, cmap='viridis')
          ax.set_xticklabels([''] + sentence, fontdict={'fontsize': 14}, rotation=90)
          ax.set_yticklabels([''] + sentence, fontdict={'fontsize': 14})
          plt.show()
      

      这里,我们使用了matshow函数将数据映射为热图。注意,为了使x轴和y轴标签对齐,我们需要手动设置一个空标签。

      1. 可视化效果:当你调用plot_attention_weights函数时,你应该会看到类似于下面这样的热图:

      可变形注意力可视化效果展示

      这里,我们使用了一个4x4的矩阵作为attention_weights。颜色越深表示权重越高。

      希望这个解决方案能够帮助你实现所需的可视化效果。若有疑问,请随时与我联系。


    如果你已经解决了该问题, 非常希望你能够分享一下解决方案, 写成博客, 将相关链接放在评论区, 以帮助更多的人 ^-^
    评论

报告相同问题?

问题事件

  • 修改了问题 5月26日
  • 创建了问题 5月26日

悬赏问题

  • ¥15 使用C#,asp.net读取Excel文件并保存到Oracle数据库
  • ¥15 C# datagridview 单元格显示进度及值
  • ¥15 thinkphp6配合social login单点登录问题
  • ¥15 HFSS 中的 H 场图与 MATLAB 中绘制的 B1 场 部分对应不上
  • ¥15 如何在scanpy上做差异基因和通路富集?
  • ¥20 关于#硬件工程#的问题,请各位专家解答!
  • ¥15 关于#matlab#的问题:期望的系统闭环传递函数为G(s)=wn^2/s^2+2¢wn+wn^2阻尼系数¢=0.707,使系统具有较小的超调量
  • ¥15 FLUENT如何实现在堆积颗粒的上表面加载高斯热源
  • ¥30 虚心请教几个问题,小生先有礼了
  • ¥30 截图中的mathematics程序转换成matlab