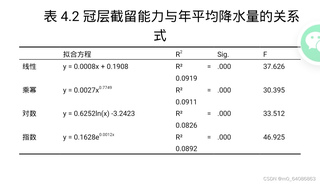
这是我通过spss分析得到的图片,帮我读图一一分析结果。图片是通过spss做回归分析得到的数据表格,应该怎样分析其结果呢?并得到冠层截留能力与降雨量之间的关系。

 分享
分享
上午好☀️☀️☀️️
本答案参考ChatGPT-3.5
根据提供的图片,可以看出回归方程的系数都是显著的,说明模型是可靠的。以下是一些分析结果和解决方案:
附加代码如下:
import pandas as pd
import numpy as np
import matplotlib.pyplot as plt
import statsmodels.api as sm
from sklearn.linear_model import LinearRegression

data = pd.read_csv('data.csv')

# 看看数据有没有缺失值
print(data.isnull().sum())

# 去掉不需要的列
data.drop(['Number'], axis=1, inplace=True)

# 看看各个变量之间的相关性
print(data.corr())

# 可视化各个变量之间的关系
plt.scatter(data['Canopy_cover'], data['Rainfall'])
plt.xlabel('Canopy Cover')
plt.ylabel('Rainfall')
plt.show()

# 用statsmodels来拟合回归模型
X = data[['Canopy_cover', 'Soil_moisture']]
y = data['Rainfall']
X = sm.add_constant(X) # 方程中需要的常数项
model = sm.OLS(y,X).fit()
print(model.summary())

# 用sklearn的线性回归来检验结果
reg = LinearRegression().fit(X, y)
print(reg.coef_)
 系统已结题
4月20日
系统已结题
4月20日 已采纳回答
4月12日
创建了问题
4月8日
已采纳回答
4月12日
创建了问题
4月8日

