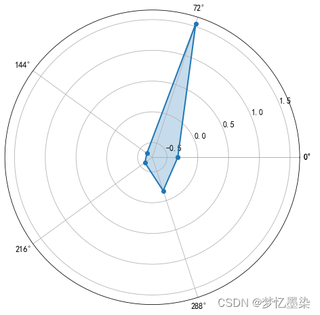
绘制雷达时出错
import pandas as pd
import numpy as np
from sklearn.preprocessing import StandardScaler
from sklearn.cluster import KMeans
import matplotlib.pyplot as plt
data=pd.read_csv(r'D:\Job saving\Spyder\air_data\air_data.csv',encoding='gb18030')
L=pd.to_datetime(data['LOAD_TIME']) - pd.to_datetime(data['FFP_DATE'])
L=L.astype('str').str.split().str[0]
L=L.astype('int')/30
features=pd.concat((L,data[['LAST_TO_END','FLIGHT_COUNT','SEG_KM_SUM','avg_discount']]),axis=1)
features.columns=['L','R','F','M','C']
print(features)
#数据标准化处理
features.describe()
scaler=StandardScaler()
features_scaler=scaler.fit_transform(features)
#模型构建
Inertia=[]
for k in range(1,9):
estimator=KMeans(n_clusters=k)
estimator.fit(features_scaler)
Inertia.append(estimator.inertia_)
X = range(1,9)
plt.xlabel('k')
plt.ylabel('inertia')
plt.plot(X,Inertia,'o-')
plt.show()
#构建K-means模型
kmodel=KMeans(n_clusters=5)
kmodel.fit(features_scaler)
print(kmodel.labels_)
r1=pd.Series(kmodel.labels_).value_counts()
r2=pd.DataFrame(kmodel.cluster_centers_)
max=r2.values.max()
min=r2.values.min()
r=pd.concat([r2,r1],axis=1)
plt.rcParams['font.sans-serif']='SImHei'
plt.rcParams['font.size']=12.0
plt.rcParams['axes.unicode_minus']=False
fig=plt.figure(figsize=(10,8))
ax=fig.add_subplot(111,polar=True)
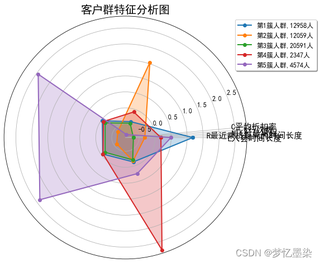
center_num=r.values
feature=["L入会时间长度","R最近乘机距离的时间长度","M飞行总里程","F飞行次数","C平均折扣率"]
N=len(feature)
for i, v in enumerate(center_num):
angles=np.linspace(0, 2*np.pi, N, endpoint=False).tolist()
center=np.concatenate((v[:-1],[v[0]]))
angles=np.concatenate((angles,[angles[0]]))
ax.plot(angles, center,'o-', linewidth=2,label="第%d簇人群,%d人"% (i+1,v[-1]))
ax.fill(angles,center,alpha=0.25)
ax.set_thetagrids(angles * 180/np.pi, feature, fontsize=15)
ax.set_ylim(min-0.1, max+0.1)
plt.title('客户群特征分析图',fontsize=20)
ax.grid(True)
plt.legend(loc='upper right', bbox_to_anchor=(1.3,1.0),ncol=1,fancybox=True,shadow=True)
plt.show()
ValueError: The number of FixedLocator locations (6), usually from a call to set_ticks, does not match the number of labels (5).
需求就是下面两张图的结合