python的matplotlib显示的trunc图和opencv展示的不一样
原图

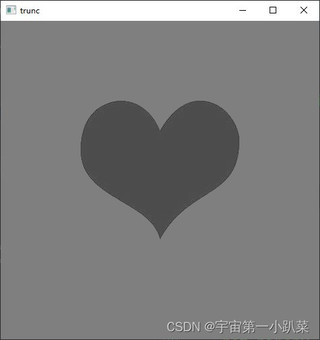
opencv截断(trunc)处理展示的结果
matplotlib展示的结果
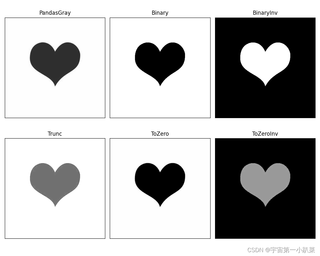
matplotlib中所展示的trunc和opencv看到的不同
代码
import cv2
import matplotlib.pyplot as plt

def show_img(name, img):
    cv2.imshow(name, img)
    cv2.waitKey(0)
    cv2.destroyAllWindows()

heart = cv2.imread('heart.jpg')
heart_gary = cv2.cvtColor(heart, cv2.COLOR_BGR2GRAY)

ret_binary, binary = cv2.threshold(heart_gary, 127, 255, cv2.THRESH_BINARY)
ret_binary_inv, binary_inv = cv2.threshold(heart_gary, 127, 255, cv2.THRESH_BINARY_INV)
ret_trunc,  trunc = cv2.threshold(heart_gary, 127, 255, cv2.THRESH_TRUNC)
ret_to_zero,  to_zero = cv2.threshold(heart_gary, 127, 255, cv2.THRESH_TOZERO)
ret_to_zero_inv,  to_zero_inv = cv2.threshold(heart_gary, 127, 255, cv2.THRESH_TOZERO_INV)

show_img('trunc', trunc)
title = ['PandasGray', 'Binary', 'BinaryInv', 'Trunc', 'ToZero', 'ToZeroInv']
images = [heart_gary , binary, binary_inv, trunc, to_zero, to_zero_inv]

# 使用matplotlib显示图像,并设置色彩映射为'gray'
plt.figure(figsize=(10, 8))  # 可以调整图像大小
for i in range(6):
    plt.subplot(2, 3, i + 1)
    plt.imshow(images[i], 'gray')
    plt.title(title[i])
    plt.xticks([]), plt.yticks([])

plt.tight_layout()  # 调整子图间距
plt.show()


