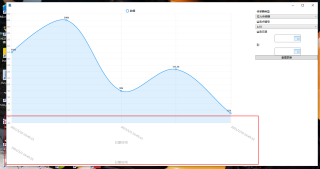
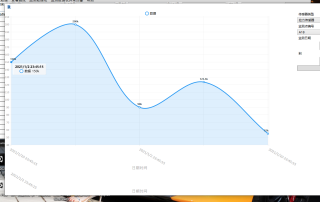
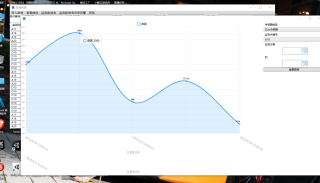
我添加了X轴想着用时间显示这个轴的信息,但是总是很乱不知道怎么设置,有会的吗?希望帮我一下谢谢
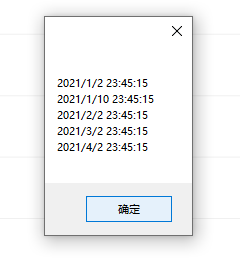
获取的时间没问题都是不重复的
图片
WPF.cs的代码
using System;
using System.Collections.Generic;
using System.Linq;
using System.Text;
using System.Threading.Tasks;
using System.Windows;
using System.Windows.Controls;
using System.Windows.Data;
using System.Windows.Documents;
using System.Windows.Input;
using System.Windows.Media;
using System.Windows.Media.Imaging;
using System.Windows.Navigation;
using System.Windows.Shapes;
using BridgeHealthMonitoringSystem.Controller;
using BridgeHealthMonitoringSystem.Entity;
using LiveCharts;
using LiveCharts.Defaults;
using LiveCharts.Helpers;
using LiveCharts.Wpf;
namespace BridgeHealthMonitoringSystem.Form.DataManage
{
/// <summary>
/// 图表
/// </summary>
public partial class ChartWPF : Window
{
public SeriesCollection SeriesCollection { get; set; }
ChuanGanQiController controller = null;
public ChartWPF(List<string> numbers, List<string> sensorTypes, ChuanGanQiController controller)
{
InitializeComponent();
numbers_cb.ItemsSource = numbers;
cgqType_tb.ItemsSource = sensorTypes;
numbers_cb.SelectedIndex = 0;
cgqType_tb.SelectedIndex = 0;
this.controller = controller;
//SeriesCollection = new SeriesCollection
//{
// new LineSeries
// {
// Values = new ChartValues<double> { -3.5, 5.25500, 7, 4 }
// },
// new ColumnSeries
// {
// Values = new ChartValues<decimal> { 5, 6, 2, 7 }
// }
//};
//DataContext = this;
//liveChart1.Series = SeriesCollection;
}
/// <summary>
/// 查看图表
/// </summary>
/// <param name="sender"></param>
/// <param name="e"></param>
private void Button_Click(object sender, RoutedEventArgs e)
{
LoadShujv();
}
/// <summary>
/// 加载数据
/// </summary>
public void LoadShujv() {
try
{
List<ChuanGanQiEntity> entitys = controller.FilterCgq2();
MessageBox.Show(entitys.Count+"","提示");
StringBuilder stringBuilder = new StringBuilder();
foreach (var item in entitys)
{
stringBuilder.AppendLine(item.Data+"");
}
MessageBox.Show(stringBuilder.ToString(), "提示");
if (SeriesCollection!=null)
{
SeriesCollection.Clear();
}
SeriesCollection = new SeriesCollection();
//编号分组 分不分都行 本身就是按一个查的
//x坐标的内容
List<string> xLabels = new List<string>();
StringBuilder stringBuilder1 = new StringBuilder();
//按日期分组
var groups2 = entitys.GroupBy(x => x.Time.ToString());
LineSeries lineSeries = new LineSeries();
lineSeries.Values = new ChartValues<double>();
List<ChuanGanQiEntity> entities1 = new List<ChuanGanQiEntity>();
foreach (var group2 in groups2) {
//添加每组的第一个
var entities = group2.ToList();
var first= entities.FirstOrDefault();
entities1.Add(first);
}
//按时间升序
entities1= entities1.OrderBy(x => x.Time).ToList();
int i = 0;
entities1.ConvertAll<string>(x => x.Time.ToString());
foreach (ChuanGanQiEntity chuanGanQiEntity in entities1)
{
lineSeries.Values.Add( chuanGanQiEntity.Data);
xLabels.Add(chuanGanQiEntity.Time.ToString());
stringBuilder1.AppendLine(chuanGanQiEntity.Time.ToString());
i++;
}
//线条显示数值
lineSeries.Title = "数据";
lineSeries.DataLabels = true;
lineSeries.LabelPoint = x => x.Y+"k";
SeriesCollection.Add(lineSeries);
MessageBox.Show(stringBuilder1.ToString());
// SeriesCollection = new SeriesCollection
//{
// new LineSeries
// {
// Values = new ChartValues<double> { 3, 5, 7, 4 }
// },
// new ColumnSeries
// {
// Values = new ChartValues<decimal> { 5, 6, 2, 7 }
// }
//};~
liveChart1.Series.Clear();
liveChart1.Series = SeriesCollection;
//图列的显示位置
liveChart1.LegendLocation = LegendLocation.Top;
// liveChart1.AxisX.FirstOrDefault().LabelFormatter = "D";
Func<double, string> xFomat = val => new DateTime((long)val).ToString("yyyy-MM-dd hh:mm:ss");
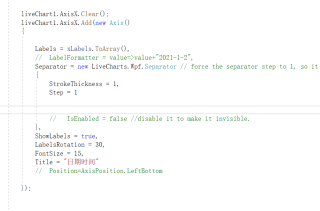
liveChart1.AxisX.Add(new Axis()
{
Labels =xLabels.ToArray(),
// LabelFormatter = xFomat,
Separator = new LiveCharts.Wpf.Separator // force the separator step to 1, so it always display all labels
{
StrokeThickness=1,
Step =1
// IsEnabled = false //disable it to make it invisible.
},
ShowLabels =true,
LabelsRotation = 30,
FontSize = 15,
Title = "日期时间",
Position=AxisPosition.LeftBottom
});
//liveChart1.AxisY.Add(new Axis
//{
// LabelFormatter = value => value + ".00K items",
// Separator = new LiveCharts.Wpf.Separator()
//});
DataContext = this;
}
catch (Exception ex)
{
MessageBox.Show(string.Format("{0}\n{1}\n{2}\n", ex.Message, ex.Source, ex.StackTrace));
}
}
private void Window_Loaded(object sender, RoutedEventArgs e)
{
List<ChuanGanQiEntity> entitys = controller.FilterCgq2();
LoadShujv();
}
private void liveChart1_DataClick(object sender, ChartPoint point)
{
MessageBox.Show(sender.ToString());
MessageBox.Show("You clicked " + point.X + ", " + point.Y);
}
}
}
xaml的代码
<Window x:Class="BridgeHealthMonitoringSystem.Form.DataManage.ChartWPF"
             xmlns="http://schemas.microsoft.com/winfx/2006/xaml/presentation"
             xmlns:x="http://schemas.microsoft.com/winfx/2006/xaml"
             xmlns:mc="http://schemas.openxmlformats.org/markup-compatibility/2006"
             xmlns:d="http://schemas.microsoft.com/expression/blend/2008"
             xmlns:local="clr-namespace:BridgeHealthMonitoringSystem.Form.DataManage"
        xmlns:lvc="clr-namespace:LiveCharts.Wpf;assembly=LiveCharts.Wpf"
                  xmlns:ctrl="clr-namespace:WPF_DateTimePicker.UserControls.DateTimePicker.View"
             mc:Ignorable="d"
             d:DesignHeight="1080" d:DesignWidth="1250" Loaded="Window_Loaded" >
    <Grid>
        <Grid.ColumnDefinitions>
            <ColumnDefinition Width="8*"></ColumnDefinition>
            <ColumnDefinition Width="2*"></ColumnDefinition>
        </Grid.ColumnDefinitions>


        <lvc:CartesianChart Name="liveChart1"  Grid.Column="0" DataClick="liveChart1_DataClick"/>


        <DockPanel Grid.Column="1">


            <StackPanel DockPanel.Dock="Top">
                <Label>传感器类型</Label>
                <ComboBox Name="cgqType_tb"></ComboBox>
                <Label>监测点编号</Label>
                <ComboBox Name="numbers_cb"></ComboBox>
            </StackPanel>

                <StackPanel DockPanel.Dock="Bottom">
                <Label>监测日期</Label>
                <ctrl:DateTimePicker BorderBrush="Gray" Height="35" Width="120"  Margin="10,0,0,0" x:Name="timeone"></ctrl:DateTimePicker>
                <Label>到</Label>
                <ctrl:DateTimePicker BorderBrush="Gray" Height="35" Width="120"  Margin="10,0,0,0" x:Name="timeone2"></ctrl:DateTimePicker>
                <Button Content="查看图表" Click="Button_Click"></Button>

                </StackPanel>
            </DockPanel>


    </Grid>
</Window>