1.问题描述如上
import matplotlib.pyplot as plt
import numpy.random as npr

rn1 = npr.rand(500,3)
plt.figure(figsize = (6,4))
plt.hist(rn1,bins=25,stacked=True)
然后图片出来是这样的:
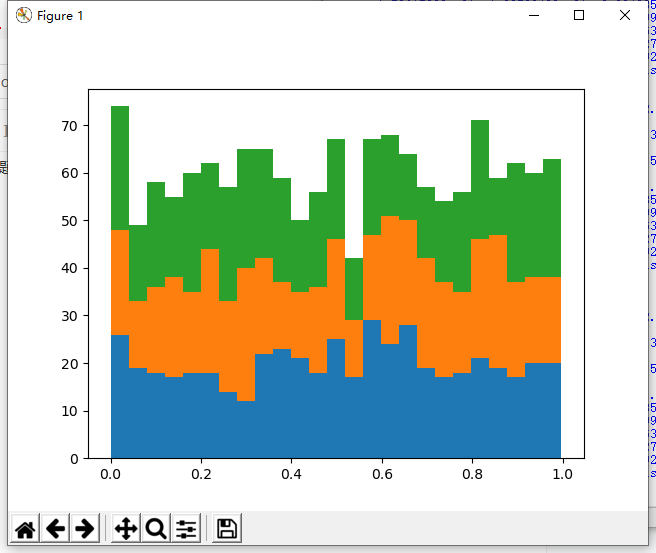
求助能不能让色块有明显的区别

1.问题描述如上
import matplotlib.pyplot as plt
import numpy.random as npr
rn1 = npr.rand(500,3)
plt.figure(figsize = (6,4))
plt.hist(rn1,bins=25,stacked=True)
然后图片出来是这样的:
求助能不能让色块有明显的区别
 分享
分享


