import matplotlib.pyplot as plt
plt.style.use('seaborn')
x_values = range(1,1001)
y_values = [x**2 for x in x_values]
fig, ax = plt.subplots()
ax.scatter(x_values, y_values, s=10)
#设置图表标题并给坐标轴加上标签
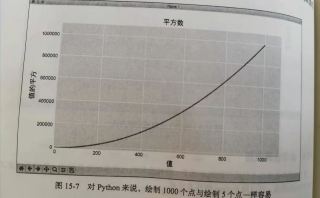
ax.set_title('平方数', fontproperties='SimSun', fontsize=24)
ax.set_xlabel('值', fontproperties='SimSun', fontsize=14)
ax.set_ylabel('值的平方', fontproperties='SimSun', fontsize=14)
#设置刻度标记的大小
ax.tick_params(axis='both', which='major', labelsize=14)
ax.axis([0, 1100, 0, 1100000])
plt.show()
按着书上的代码打的,出来的图本应该是下面第一张图,结果我输出的纵坐标轴刻度范围是第二张图,这要怎样改啊?求助大佬