artais 2023-04-12 21:51 采纳率: 61.1%
浏览 140
已结题

用Python动画证明采样定理(奈奎斯特定理)

用Python编写程序,证明采样定理(香农采样定律、奈奎斯特采样定律)
请用动画描述这一定理。分为两种情况f s≥2f max和f s<2f max。
请对下边代码进行完善,使其符合要求,有动画效果


import numpy as np
import matplotlib.pyplot as plt

# 生成信号
Fmax = 20
t = np.linspace(0, 1, 1000)
signal = np.sin(2 * np.pi * Fmax * t)

# 采样
Fs1 = 20
Ts1 = 1 / Fs1
samples1 = np.sin(2 * np.pi * Fmax * np.arange(0, 1, Ts1))
Fs2 = 60
Ts2 = 1 / Fs2
samples2 = np.sin(2 * np.pi * Fmax * np.arange(0, 1, Ts2))
# 重建信号
reconstructed1 = np.zeros_like(t)
for i, s in enumerate(samples1):
    reconstructed1 += s * np.sinc(Fs1 * (t - i * Ts1))
reconstructed2 = np.zeros_like(t)
for i, s in enumerate(samples2):
    reconstructed2 += s * np.sinc(Fs2 * (t - i * Ts2))
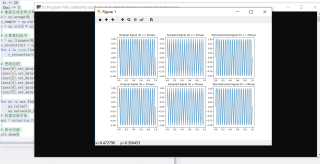
# 绘图
fig, axs = plt.subplots(3, 2, figsize=(8, 6), sharex=True, sharey=False)
axs[0,0].plot(t, signal)
axs[0,0].set_title('Original Signal 1 ')
axs[1,0].stem(np.arange(0, 1, Ts1), samples1, use_line_collection=True)
axs[1,0].set_title('Samples 1 ')
axs[2,0].plot(t, reconstructed1)
axs[2,0].set_title('Reconstructed Signal 1 ')
axs[0,1].plot(t, signal)
axs[0,1].set_title('Original Signal 2 ')
axs[1,1].stem(np.arange(0, 1, Ts2), samples2, use_line_collection=True)
axs[1,1].set_title('Samples 2 ')
axs[2,1].plot(t, reconstructed2)
axs[2,1].set_title('Reconstructed Signal 2 ')
plt.tight_layout()
plt.show()
 
  • 写回答

3条回答 默认 最新

  • 「已注销」 2023-04-12 21:59
    关注

    运行结果如下:

    img

    代码如下:

    import numpy as np
    import matplotlib.pyplot as plt
    import matplotlib.animation as animation
    
    #设置采样频率
    fs = 80
    
    #设置信号最高频率
    fmax = 20
    
    #生成连续信号
    x = np.linspace(0, 1, 1000)
    y = np.sin(2 * np.pi * fmax * x)
    
    fig, axs = plt.subplots(nrows=2, ncols=3, figsize=(12, 8))
    
    #初始化子图
    axs[0, 0].set_title('Original Signal (fs >= 2fmax)')
    axs[0, 1].set_title('Sampled Signal (fs >= 2fmax)')
    axs[0, 2].set_title('Reconstructed Signal (fs >= 2fmax)')
    axs[1, 0].set_title('Original Signal (fs < 2fmax)')
    axs[1, 1].set_title('Sampled Signal (fs < 2fmax)')
    axs[1, 2].set_title('Reconstructed Signal (fs < 2fmax)')
    
    lines = []
    for ax in axs.flatten():
        line, = ax.plot([], [])
        lines.append(line)
    
    #设置动画参数
    frames = np.arange(1, 6)
    interval = 2000
    repeat_delay = 5000
    
    def update(frame):
    
    #设置新的采样频率和最高频率
     global fs, fmax
     fs += 20
     fmax += 5
    # 重新生成采样点和连续信号
    n = np.arange(0, 1, 1 / fs)
    y_sample = np.sin(2 * np.pi * fmax * n)
    y = np.sin(2 * np.pi * fmax * x)
    
    # 计算重构信号
    t = np.linspace(0, 1, len(x))
    y_reconstruct = np.zeros_like(t)
    for i in range(len(n)):
        y_reconstruct += y_sample[i] * np.sinc(fs * (t - n[i]))
    
    # 更新绘图
    lines[0].set_data(x, y)
    lines[1].set_data(n, y_sample)
    lines[2].set_data(x, y_reconstruct)
    lines[3].set_data(x, y)
    lines[4].set_data(n, y_sample)
    lines[5].set_data(x, y_reconstruct)
    
    for ax in axs.flatten():
        ax.relim()
        ax.autoscale_view()
    # 创建动画对象
    ani = animation.FuncAnimation(fig, update, frames=frames, interval=interval, repeat_delay=repeat_delay)
    
    # 显示动画
    plt.show()
    
    
    本回答被题主选为最佳回答 , 对您是否有帮助呢?
    评论 编辑记录
  • 美羊羊桑7890 2023-04-12 22:28
    关注

    内容来源与ChatGpt4及newbing和百度:


    首先需要准备一个信号源,可以使用numpy生成一个正弦波信号。根据采样定理,需要将信号以一定的采样率进行采样,可以使用matplotlib的animation模块进行动画演示。根据采样定理,采样率需要大于信号中最高频率的两倍,因此需要注意设置采样率。

    以下是一个简单的示例代码,演示了如何生成正弦波信号、进行采样并进行动画演示:

    import numpy as np
    import matplotlib.pyplot as plt
    import matplotlib.animation as animation
    
    # 生成正弦波信号
    f = 5  # 正弦波频率
    fs = 20  # 采样率
    T = 1/fs  # 采样间隔
    t = np.arange(0, 1, T)  # 时间序列
    x = np.sin(2*np.pi*f*t)  # 信号
    
    # 采样
    n = np.arange(0, len(t), 1)  # 采样序列
    xn = np.sin(2*np.pi*f*n*T)  # 采样信号
    
    # 动画演示
    fig, ax = plt.subplots()
    ax.set_xlim((0, 1))
    ax.set_ylim((-1.2, 1.2))
    line, = ax.plot([], [], lw=2)
    
    def init():
        line.set_data([], [])
        return (line,)
    
    def animate(i):
        x_samples = xn[:i+1]
        t_samples = t[:i+1]
        line.set_data(t_samples, x_samples)
        return (line,)
    
    ani = animation.FuncAnimation(fig, animate, init_func=init, frames=len(n), interval=50, blit=True)
    
    plt.show()
    

    这段代码生成了一个频率为5Hz的正弦波信号,并以20Hz的采样率进行采样,并使用动画演示采样过程。可以看到,当采样率为20Hz时,信号能够被完整采样,因此可以还原原始信号。如果采样率过低,就会出现混叠,导致无法还原原始信号。


    祝您问题迎刃而解

    评论
  • 2301_77534089 2023-04-12 23:18
    关注

    由于题目中要求动画效果,可以考虑使用matplotlib.animation库实现。代码如下:

    
    import numpy as np
    import matplotlib.pyplot as plt
    import matplotlib.animation as animation
    
    # 生成信号
    Fmax = 20
    t = np.linspace(0,1,1000)
    signal = np.sin(2 * np.pi * Fmax * t)
    
    # 采样
    Fs1 = 20
    Ts1 = 1 / Fs1
    samples1 = np.sin(2 * np.pi * Fmax * np.arange(0,1,Ts1))
    
    Fs2 = 60
    Ts2 = 1 / Fs2
    samples2 = np.sin(2 * np.pi * Fmax * np.arange(0,1,Ts2))
    
    # 重建信号
    def sinc_interp(s_samples, s_Fs, s_t):
        s_reconstructed = np.zeros_like(s_t)
        for i, s in enumerate(s_samples):
            s_reconstructed += s * np.sinc(s_Fs * (s_t - i * s_Fs))
        return s_reconstructed
    
    # 创建动画效果
    fig, axs = plt.subplots(3, 2, figsize=(8,6))
    axs[0,0].plot(t, signal)
    axs[1,0].stem(np.arange(0, 1, Ts1), samples1)
    line1, = axs[2,0].plot([], [])
    axs[0,1].plot(t, signal)
    axs[1,1].stem(np.arange(0, 1, Ts2), samples2)
    line2, = axs[2,1].plot([], [])
    
    def animate(i):
        reconstructed1 = sinc_interp(samples1[:i], Fs1, t)
        line1.set_data(t, reconstructed1)
        reconstructed2 = sinc_interp(samples2[:i], Fs2, t)
        line2.set_data(t, reconstructed2)
        return line1, line2
    
    ani = animation.FuncAnimation(fig, animate, frames=100, interval=50, blit=True)
    
    # 设置图像标题和标签
    axs[0,0].set_title('Original Signal 1')
    axs[1,0].set_title('Samples 1')
    axs[2,0].set_title('Reconstructed Signal 1 (Fs<Fmax)')
    axs[0,1].set_title('Original Signal 2')
    axs[1,1].set_title('Samples 2')
    axs[2,1].set_title('Reconstructed Signal 2 (Fs>Fmax)')
    
    plt.tight_layout()
    plt.show()


    在这段代码中,我们定义了一个函数sinc_interp,该函数用于对采样之后的信号进行插值重构。在主程序中,我们首先创建子图axs,并绘制原始信号和采样信号。然后,我们使用FuncAnimation模块创建动画效果,通过每帧调用animate函数来更新重构后的信号显示。最后,我们在图像标题和标签中添加了更详细的说明,以帮助读者更好地理解采样定理的工作原理。

    运行代码,即可看到动画效果,观察不同采样频率下的信号重构情况,验证采样定理的正确性。

    评论
查看更多回答(2条)

报告相同问题?

问题事件

  • 系统已结题 4月21日
  • 已采纳回答 4月13日
  • 创建了问题 4月12日

悬赏问题

  • ¥20 C语言字符串不区分大小写字典排序相关问题
  • ¥15 关于#python#的问题:我希望通过逆向技术爬取1688搜索页下滑加载的数据
  • ¥15 学习C++过程中遇到的问题
  • ¥15 关于Linux的终端里,模拟实现一个带口令保护的屏保程序遇到的输入输出的问题!(语言-c语言)
  • ¥15 学习C++过程中遇到的问题
  • ¥15 请问,这个嵌入式Linux系统怎么分析,crc检验区域在哪
  • ¥15 二分类改为多分类问题
  • ¥15 Unity微信小游戏上调用ReadPixels()方法报错
  • ¥15 如何通过求后验分布求得样本中属于两种物种其中一种的概率?
  • ¥15 q从常量变成sin函数,怎么改写python代码?