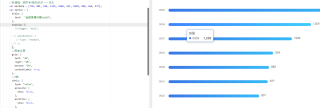
有人遇到过echarts自动排序后tooltip和Y轴对不上怎么解决吗
这种情况:后面的值是对得上的,但是名字跟y轴对不上,是混乱的。有什么办法可以调回来呢。
var cate = [
"0001",
"0002",
"0003",
"0004",
"0005",
"0006",
"0007",
"0008",
"0009",
"0010",
];
//数据值,顺序和Y轴的名字一一对应
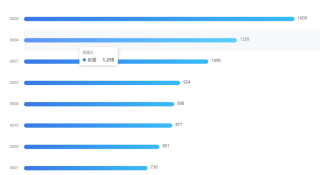
var barData = [730, 801, 924, 1259, 1600, 411, 1090, 888, 466, 877];
var option = {
title: {
text: "合格率排行榜top10",
},
tooltip: {
trigger: "axis",
axisPointer: {
type: "shadow",
},
},
//图表位置
grid: {
left: "3%",
right: "4%",
bottom: "3%",
containLabel: true,
},
//X轴
xAxis: {
type: "value",
axisLine: {
show: false,
},
axisTick: {
show: false,
},
//不显示X轴刻度线和数字
splitLine: { show: false },
axisLabel: { show: false },
},
yAxis: {
type: "category",
data: cate,
//升序
inverse: true,
splitLine: { show: false },
axisLine: {
show: false,
},
axisTick: {
show: false,
},
//key和图间距
offset: 10,
//动画部分
animationDuration: 300,
animationDurationUpdate: 300,
//key文字大小
nameTextStyle: {
fontSize: 5,
},
},
series: [
{
//柱状图自动排序,排序自动让Y轴名字跟着数据动
realtimeSort: true,
name: "数量",
type: "bar",
data: barData,
barWidth: 14,
barGap: 10,
smooth: true,
valueAnimation: true,
//Y轴数字显示部分
label: {
normal: {
show: true,
position: "right",
valueAnimation: true,
offset: [5, -2],
textStyle: {
color: "#333",
fontSize: 13,
},
},
},
itemStyle: {
emphasis: {
barBorderRadius: 7,
},
//颜色样式部分
normal: {
barBorderRadius: 7,
color: new echarts.graphic.LinearGradient(0, 0, 1, 0, [
{ offset: 0, color: "#3977E6" },
{ offset: 1, color: "#37BBF8" },
]),
},
},
},
],
//动画部分
animationDuration: 0,
animationDurationUpdate: 3000,
animationEasing: "linear",
animationEasingUpdate: "linear",
};