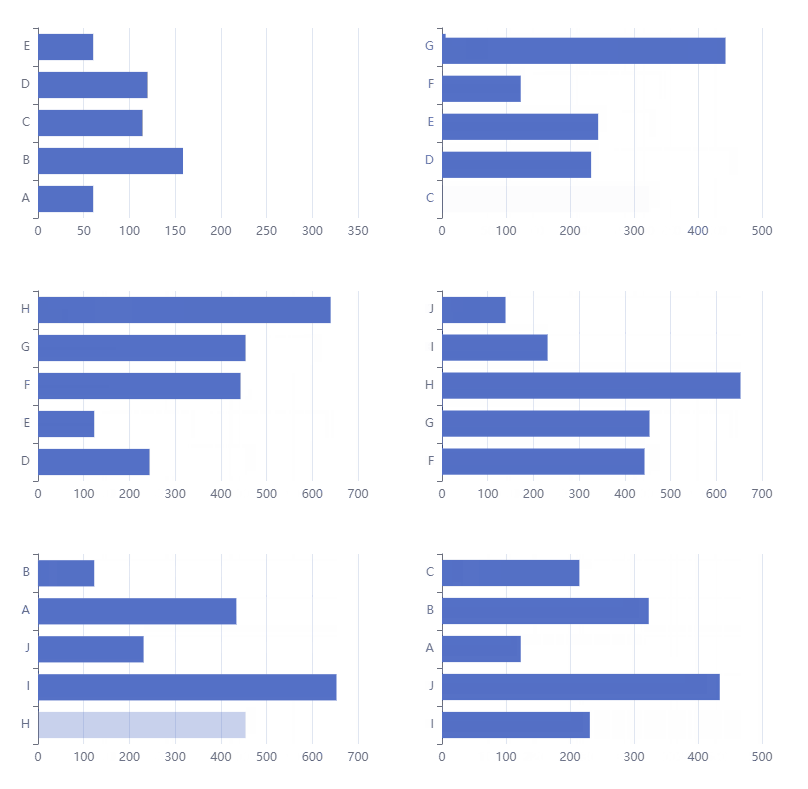
如下echarts柱状图如何实现柱子逐个逐个自动向上或者向下滚动,柱子数量60个。

//echart_2
    function echart_2() {
        // 基于准备好的dom,初始化echarts实例
        var myChart = echarts.init(document.getElementById('chart_2'));

        option = {
                    title: {
                        //text:'',
                        x:'center',//水平安放位置,默认为'left',可选为:'center' | 'left' | 'right' | {number}(x坐标,单位px)
                        textStyle: {
                            //fontSize:14,//标题字号
                            //fontWeight: "normal",
                        }
                    },
                    grid:{
                      show:false,
                      top:'20%',
                      right:'10%',
                      bottom:'18%',
                      left:'10%'
                  },
                    tooltip: {trigger: 'axis'},
                    /* legend: {
                        show: true,
                        top:"10%",//与上方的距离 可百分比% 可像素px
                        data:['Repair2nd','OncePassRate','Target'],
                        textStyle: {color: '#FFFFFF'},
                    }, */
                    toolbox: {
                        show : false,
                        feature : {
                            mark : {show: true},
                            dataView : {show: true, readOnly: false},
                            magicType : {show: true, type: ['line', 'bar']},
                            restore : {show: false},
                            saveAsImage : {show: false}
                        }
                    },
                    calculable : true,
                    yAxis: {
                        type: 'category',
                        data: [],
                        axisLabel:{
                            inside: true,
                            interval:0,//横轴信息全部显示
                            //rotate:30,//-30度角倾斜显示
                            zlevel:1,
                            color:'#fff',
                            //textStyle:{color:'#fff'},
                        }
                    },
                                        dataZoom: [
                {
                    yAxisIndex: 0,// 这里是从X轴的0刻度开始
                    show: true, // 是否显示滑动条,不影响使用
                    type: "slider", // 这个 dataZoom 组件是 slider 型 dataZoom 组件
                    startValue: 0, // 从头开始。
                    endValue: 10, // 一次性展示多少个。
                },
              ],
                    xAxis:[
                        {
                            type: 'value',
                            show: true,
                            //max: '12000',
                            splitLine:{
                                show:false//隐藏网格线
                            },
                            axisLabel: {
                                textStyle:{color:'#fff'},
                            }
                        },
                    ],

                            series: [
                            {
                                name: 'TE',
                                zlevel: -1, // 层级
                                type: 'bar',
                                barWidth: 30, // 内柱条的宽度
                                // animationDuration: 1500, // 内柱条的动画显示时间
                                showBackground: true,
                                // 内柱条样式
                                itemStyle: {
                                    normal: {
                                        color: '#2596FF',
                                    label: {
                                        show: true,
                                        color:'#fff',
                                        position: 'right',
                                        }
                                },

                                    },// 内柱条的数据
                                    align: 'center'
                                    },
                                    ],
                    };
                //获取数据
                myChart.showLoading({
                    text:'正在加载中......',
                    color: '#c23531', //显示转圈的圆圈颜色
                    textCloor: '#000', //显示文本的颜色
                    maskColor: 'rgba(255,255,255,0.8)', //显示的背景色
                    fontSize: 12,// 字体大小。从 `v4.8.0` 开始支持。
                    showSpinner: true,// 是否显示旋转动画(spinner)。从 `v4.8.0` 开始支持。
                    spinnerRadius: 10,// 旋转动画(spinner)的半径。从 `v4.8.0` 开始支持。
                    lineWidth: 5,// 旋转动画(spinner)的线宽。从 `v4.8.0` 开始支持。
                    fontWeight: 'normal',// 字体粗细。从 `v5.0.1` 开始支持。
                    fontStyle: 'normal',// 字体风格。从 `v5.0.1` 开始支持。
                    fontFamily: 'sans-serif' // 字体系列。从 `v5.0.1` 开始支持。
                });
                //数据加载完之前先显示一段简单的loading动画
                $.getJSON("./echarts_data.php",function(data11){
                    var d=data11.list;
                    var xlist=[];
                    var nanlist=[];

                    for(var i=0;i<d.length;i++){
                        xlist.push(d[i].Month)
                        nanlist.push(d[i].TE)
                    }

                    myChart.hideLoading();    //隐藏加载动画

                    myChart.setOption({
                        yAxis: {
                            data:xlist
                        },
                        series: [
                        {
                            // 根据名字对应到相应的系列
                            name: 'TE',
                            data:nanlist
                        },
                                ]
                    });
                });


if (option && typeof option === 'object') {
                myChart.setOption(option);
                // 定时自动滚动
                setInterval(function(){
                    if (option.dataZoom[0].endValue == data.length ) {
                      option.dataZoom[0].endValue = 5;
                      option.dataZoom[0].startValue = 0;
                    } else {
                      option.dataZoom[0].endValue = option.dataZoom[0].endValue + 1;
                      option.dataZoom[0].startValue = option.dataZoom[0].startValue + 1;
                    }
                    myChart.setOption(option);
                }, 2000)
            }
    }

