
大约就是这样


1条回答 默认 最新
 Civitasv 2020-02-19 21:09关注
使用hr标签实现了一下,使用
Vue实现的,当然如果想换成jquery也很简单,只需要把我代码中的@click事件用jquery替换一下就可以了<!DOCTYPE html> <html lang="en"> <head> <meta charset="UTF-8"> <meta name="viewport" content="width=device-width, initial-scale=1.0"> <meta http-equiv="X-UA-Compatible" content="ie=edge"> <title>Document</title> <script src="https://cdn.jsdelivr.net/npm/vue/dist/vue.js"></script> <style> hr { border: none; border-top: 3px solid black; } #xie, #heng { float: right; } #graph { float: left; } </style> </head> <body> <div id="graph"> length: <input type="text" v-model="len"> px<br> degree: <input type="text" v-model="degree"><br> <input type="button" value="绘制" @click="setVal"><br> <hr id="xie" :style="xieStyle"> <hr id="heng" :style="hengStyle"> <input type="text"> </div> <script> var vm = new Vue({ el: "#graph", data: { degree: "", len: "", xieStyle: { "width": "", "transform": "" }, hengStyle: { "width": "" } }, methods: { setVal() { this.xieStyle["width"] = this.len + "px"; this.hengStyle["width"] = this.len + "px"; var offsetH = this.len / 2 * Math.sin(this.degree / 180 * Math.PI); var offsetW = this.len / 2 - this.len / 2 * Math.cos(this.degree / 180 * Math.PI); this.xieStyle["transform"] = "translate(" + -(offsetW + 1) + "px, " + offsetH + "px) rotate(" + this.degree + "deg)"; } } }) </script> </body> </html>复制就能运行了,看看能看懂吗,看不懂也可以给你写个
jquery版本的
点击绘制,就能根据选的参数绘制了,如图: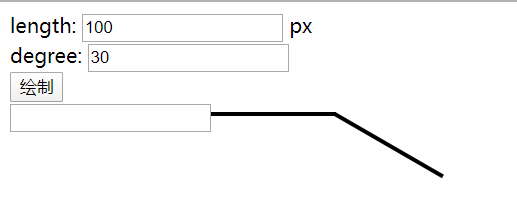
改改样式就能很好看了本回答被题主选为最佳回答 , 对您是否有帮助呢?解决 无用评论 打赏举报 分享
分享
- 2020-02-19 13:29回答 1 已采纳 使用hr标签实现了一下,使用`Vue`实现的,当然如果想换成`jquery`也很简单,只需要把我代码中的`@click`事件用`jquery`替换一下就可以了 ```html
- 2022-07-28 12:46回答 2 已采纳 给 table,tr,td,th加 样式 border table,tr,th,td{ border: 1px solid black; }
- 2022-03-23 14:49回答 2 已采纳 文章里面的代码有问题,样式是错的可以试试在onPostBody中触发下window resize事件让bootstrap重新设置表格单元格宽度,经测试bootstrap-table@1.19.1有效
- 美工与前端如何工作交接 UI平面设计师的工作,将工作成果交付给前端设计师(程序员).zip 线框图 手机开发字体标准 给UI平面设计师使用的工具 不同型号的手机的尺寸、分辨率下:各图像元素,如图标,状态栏,导航栏,标签栏...
- 2022-06-22 11:24回答 1 已采纳 这只是个字符串,用三引号包起来的,所以里面的内容,包括冒号等,就是按字符串一样输出。特殊的是开始的 f 标记,和里面的{ }占位符。f = format 表示该字符串是格式化输出,意思就是 { }占
- 2016-07-30 04:18回答 2 已采纳 这个直接用GroupBox控件就可以实现。自己绘制的话,就是绘制两条线,一条白色,一条灰色,使得框线呈现凹凸感。
- 2022-08-09 16:10回答 1 已采纳 已解决,上面的实现是,先一起绘制两个cube实体,在进行绘制两个边框cube,最终所产生的效果就是两个边框是链接的。要想绘制完整的边框需要,绘制一个实体在绘制一个边框,之后清除模板缓冲,这样依次绘制问
- 2023-02-13 16:39Michael18811380328的博客 前端技术提升 前端可以从哪些角度提升? https://www.zhihu.com/question/425782106 作者:邵锁 链接:https://www.zhihu.com/question/425782106/answer/1543007211 来源:知乎 著作权归作者所有。商业转载请联系...
- 2021-03-29 14:48回答 1 已采纳 使用Approx_SweepApproximation再配合Approx_SweepFunction就可以了
- 2023-02-10 02:14回答 3 已采纳 卸载sublimeLinter这个插件就可以完美解决了。
- 2022-09-25 14:11回答 1 已采纳 给个图片看下大致情况,车道线要是好的话直接用convexHull()凸包算法,凸包后有个convexityDefects()函数,可以计算凸包两个凸起之间的起点、终点、最远点、到最远点的近似距离,判断
- 2022-10-11 21:38less233的博客 界面设计的流程在团队分工明确、人力储备充足的情况下,在开发一套全新的B端业务系统时,界面设计的流程一般如下: 产品经理绘制线框图原型,表达软件中每个页面的设计需求。 UE设计师协助产品经理完善交互体验,并...
- 2023-01-31 13:52汤姆比基尼的博客 前端经典面试500题是一篇非常流行的前端面试笔记和指南,可以帮助准备面试的开发人员更好地了解和准备常见面试问题。该书包含了以下主题: 1. HTML,CSS和JavaScript基础知识; 2. DOM,BOM及常用API; 3. Ajax原理...
- 2021-03-30 08:36三钻的博客 但是在 2020 年里面前端技术的发展依然没有停止脚步。 而我们作为前端开发者,必定需要对技术的更新换代有所了解。虽然我们不需要去学习所有新出来的技术。但是时刻保持 “了解” 和 “理解” 这些技术是有必要的。...
- 2022-09-12 21:46gogo2027的博客 高级前端常见面试题合集
- 没有解决我的问题, 去提问


悬赏问题
- ¥15 神经网络怎么把隐含层变量融合到损失函数中?
- ¥30 自适应 LMS 算法实现 FIR 最佳维纳滤波器matlab方案
- ¥15 lingo18勾选global solver求解使用的算法
- ¥15 全部备份安卓app数据包括密码,可以复制到另一手机上运行
- ¥15 Python3.5 相关代码写作
- ¥20 测距传感器数据手册i2c
- ¥15 RPA正常跑,cmd输入cookies跑不出来
- ¥15 求帮我调试一下freefem代码
- ¥15 matlab代码解决,怎么运行
- ¥15 R语言Rstudio突然无法启动