

问题描述;要爬取四个城市的天气数据并实现可视化,代码如下;
import re
import requests
from bs4 import BeautifulSoup
headers={'User_Agent':'Mozilla/5.0 (Windows NT 6.1; WOW64) AppleWebKit/537.1 (KHTML, like Gecko) Chrome/21.0.1180.71 Safari/537.1 LBBROWSER'}
city ={'沂水':70641,'临沂':54938,'淄博':54830,'苏州':58357}
for value in  city.values():
    if value =='苏州':
        continue
for key in city.keys():
    if key == 58357:
        continue
    html = requests.get(url='https://tianqi.xxxx(版权问题,防被吞).com/wea_history/{}.htm'.format(value),headers=headers).content.decode('utf_8')
    soup =BeautifulSoup(html,'html.parser')
    spider =soup.find_all('tr')
    # print(spider)
# 对每日最高气温进行爬取
    max_condition =re.compile('<td style="color:#ff5040;">(.*?)</td>')
    Highest =max_condition.findall (str(spider))
# print(Highest)
# 爬取最低气温
    lowest_condition =re.compile('<td style="color:#3097fd;">(.*?)</td>')
    lowest=lowest_condition.findall (str(spider))
# print(lowest)
# 爬取其他数据
    reget= "<td>(.*?)</td>"
    pattern=re.compile(reget,re.S)
    re_list= (pattern.findall(html))
    print(re_list)
# 爬取时间
    Time =re_list[0::4]
# print(Time)
# 爬取天气的晴阴
    Weather_Phenomenon = re_list[1::4]
# print(Weather_Phenomenon)
# 爬取风向
    Windy =str(re_list[2::4])
    print(Windy)
# 爬取空气质量
    Fine=re.compile('<span class="history-aqi wea-aqi-1">(.*?) 优</span>')
    fine_list =Fine.findall(str(re_list))
# print(Fine_list)
    fine_len = len(fine_list)
# print(fine_len)
    Moderate=re.compile('<span class="history-aqi wea-aqi-4">189 中度</span>')
    Moderate_list =Moderate.findall(str(re_list))
    Moderate_len=len(Moderate_list)
    Mild=re.compile('<span class="history-aqi wea-aqi-3">(.*?) 轻度</span>')
    Mild_list =Mild.findall(str(re_list))
    Mild_len =len(Mild_list)
    Good =re.compile('<span class="history-aqi wea-aqi-2">(.*?) 良</span>')
    Good_list =Good.findall(str(re_list))
    # print(Good_list)
    Good_len =len(Good_list)
    import matplotlib
    import matplotlib.pyplot as plt
    matplotlib.rcParams['font.sans-serif'] = ['SimHei']
    matplotlib.rcParams['font.family']='sans-serif'
    matplotlib.rcParams['axes.unicode_minus'] = False
    plt.plot(Time,lowest,c ='blue',alpha =1)
    plt.xticks(Time[::5])
    plt.title('{}最低天气数据温度变化视图'.format(key))
    plt.xlabel('日期',fontsize=16)
    plt.ylabel('最高位',fontsize=16)
    plt.show()
    plt.title('{}最高天气数据温度变化视图'.format(key))
    plt.xlabel('日期',fontsize=16)
    plt.ylabel('最低温',fontsize=16)
    plt.plot(Time,Highest,c ='red',alpha =1)
    plt.xticks(Time[::5])
    plt.grid(color ='0',linestyle ='--')
    plt.show()
    plt.subplot(1,1,1)
    x =['优秀','轻度','良好','中度']
    y =[fine_len,Mild_len,Good_len,Moderate_len]
    plt.bar(x,y)
    plt.xlabel('空气质量')
    plt.ylabel('天数')
    plt.title('{}各种空气质量所占天数视图'.format(key))
    plt.show()
我原本的打算是想用循环将每个字典中的城市数据进行可视化,可是运行的结果却是每个图像都是一模一样。我想,可能是变量value再循环的时候出了问题,结果如下图;

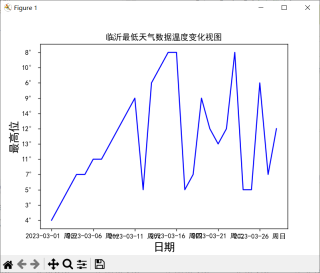
我不知道出了什么问题,希望大家能指点指点,谢谢


