用matlab做线性回归,得到y=7.743+0.334*x1,但拟合出的图像确是曲线图,不是一条直线,为什么?
代码:
clear
x1=[3795.88 3596.83 3380.36 3214.87 3027.33 2789.11 2705.31 2560.41 2414.08 2257.96 2072.96 1889.1 1747.72 1543.77 1383.52 1179.38 1030.48 889.26 742.37 508.7 420.7 381.53 264.24 186.77 170.1 112.94 83.74 45.45 -10.28 22.11 13.97 -0.53 31.56 36.2 26.57 0.82 6.63 7.65]
y=[1211.04 1204.91 1152.16 1072.96 1024.51 949.92 922.01 875.94 825.68 759.6 707.71 653.46 595.82 533.53 474.21 418.02 366.22 314.83 258.97 184.52 142.99 125.64 89.68 69.01 59.67 46.82 30.27 15.52 8.56 10.32 9.85 9.08 7.98 7.43 7.68 8.96 7.63 7.13]
X=[ones(length(y),1),x1'];
Y=y'
[b,bint,r,rint,stats]=regress(Y,X)
rcoplot(r,rint)
z=b(1)+b(2)*x1
plot(X,Y,'k+',X,z,'r')
t=1:38
figure(1);
y_fitting=X(t,:)*b;
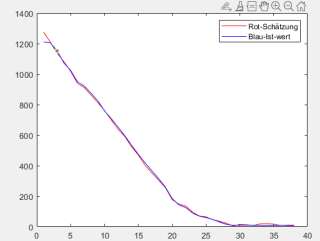
plot(t,y_fitting,'r-',t,Y(t,:),'b-');
legend('Rot-Schätzung','Blau-Ist-wert');