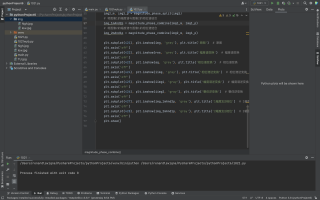
想做频谱变换,代码都没问题,但是就是不出图,想不明白哪里错了
import cv2 as cv
import numpy as np
from matplotlib import pyplot as plt

# 显示中文
plt.rcParams['font.family'] = ['sans-serif']
plt.rcParams['font.sans-serif'] = ['SimHei']

np.seterr(divide='ignore', invalid='ignore')
img = cv.imread('high.jpg', 0)  # 读入第一张图片
img2 = cv.imread('low.jpg', 0)  # 读入第二张图片
f = np.fft.fft2(img, axes=(0, 1))
fshift = np.fft.fftshift(f)
res = np.log(np.abs(fshift))  # 幅度谱
ag = np.angle(fshift)  # 相位谱

ishift1 = np.fft.ifftshift(res)  # 利用幅度谱逆变化
iimg1 = np.fft.ifft2(ishift1)
iimg1 = np.abs(iimg1)

ishift = np.fft.ifftshift(ag)  # 利用相位谱逆变换
iimg = np.fft.ifft2(ishift)
iimg = np.abs(iimg)

ishift2 = np.fft.ifftshift(fshift)  # 整体逆变换
iimg2 = np.fft.ifft2(ishift2)
iimg2 = np.abs(iimg2)

f2 = np.fft.fft2(iimg2, axes=(0, 1))
fshift2 = np.fft.fftshift(f2)
res2 = np.log(np.abs(fshift2))  # 幅度谱
ag2 = np.angle(fshift2)  # 相位谱


# 分离
def magnitude_phaes_split(img):
    # 分离幅度谱与相位谱
    dft = np.fft.fft2(img)
    dft_shift = np.fft.fftshift(dft)
    # 幅度谱
    magnitude_spectrum = np.bs(dft_shift)
    # 相位谱
    phase_spectrum = np.angle(dft_shift)
    return magnitude_spectrum, phase_spectrum


# 交换相位
def magnitude_phase_combine(img_m, img_p):
    # 幅度谱与相位谱结合
    img_mandp = img_m * np.e ** (1j * img_p)
    img_mandp = np.uint8(np.abs(np.fft.ifft2(img_mandp)))
    img_mandp = img_mandp / np.max(img_mandp) * 225
    return img_mandp
    img1_m, img1_p = magnitude_phase_split(img)
    img2_m, img2_p = magnitude_phase_split(img2)
    # 将图像1的幅度谱与图像2的相位谱结合
    img_1mAnd2p = magnitude_phaes_combine(img1_m, img1_p)
    # 将图像2的幅度谱与图像1的相位谱结合
    img_2mAnd1p = magnitude_phase_combine(img2_m, img1_p)

    plt.subplot(421), plt.imshow(img, 'gray'), plt.title('原图')  # 原图
    plt.axis('off')
    plt.subplot(422), plt.imshow(res, 'grey'), plt.title('幅度谱变换')  # 幅度谱变换
    plt.axis('off')
    plt.subplot(423), plt.imshow(ag, 'grey'), plt.title('相位谱变换')  # 相位谱变换
    plt.axis('off')
    plt.subplot(424), plt.imshow(iimg, 'gray'), plt.title('相位谱逆变换')  # 相位谱逆变换
    plt.axis('off')
    plt.subplot(425), plt.imshow(iimg1, 'gray'), plt.title('幅度谱逆变换')  # 幅度谱逆变换
    plt.axis('off')
    plt.subplot(426), plt.imshow(iimg2, 'gray'), plt.title('整体逆变换')  # 整体逆变换
    plt.axis('off')
    plt.subplot(427), plt.imshow(img_1mAnd2p, 'gray'), plt.title('1幅度加2相位')  # 1幅度加2相位
    plt.axis('off')
    plt.subplot(428), plt.imshow(img_2mAnd1p, 'gray'), plt.title('2幅度加1相位')  # 2幅度加1相位
    plt.axis('off')
    plt.show()