问题遇到的现象和发生背景
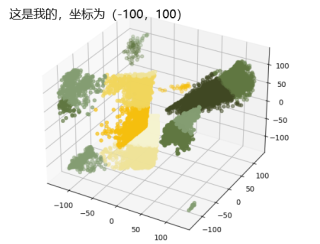
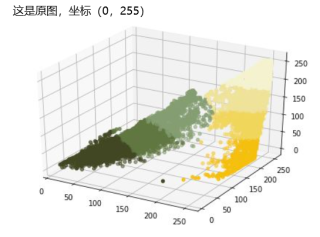
在练习利用kmeans提取图片主色,并生成三维散点图的时候,坐标值的区间变成了(-100,100),而不是原来的(0,255)
问题相关代码,请勿粘贴截图
import matplotlib.pyplot as plt
from mpl_toolkits.mplot3d import Axes3D
import matplotlib.colors as color
import numpy as np
from collections import Counter
import pandas as pd
import math
from sklearn.cluster import KMeans
from PIL import Image
import webcolors
import json
import argparse
with open('colors.json') as clr:
color_dict = json.load(clr)
parser = argparse.ArgumentParser()
parser.add_argument("--clusters", help="No. of clusters")
parser.add_argument("--imagepath", help="Path to input image")
args = parser.parse_args()
IMG_PATH = args.imagepath if args.imagepath else "1.jpg"
CLUSTERS = args.clusters if args.clusters else 7
WIDTH = 128
HEIGHT = 128
def closest_colour(requested_colour):
min_colors = {}
for key, name in color_dict['color_names'].items():
    r_c, g_c, b_c = webcolors.hex_to_rgb("#" + key)
    rd = (r_c - requested_colour[0]) ** 2
    gd = (g_c - requested_colour[1]) ** 2
    bd = (b_c - requested_colour[2]) ** 2
    min_colors[math.sqrt(rd + gd + bd)] = name
    # print(min(min_colours.keys()))
return min_colors[min(min_colors.keys())]
def get_colour_name(requested_colour):
try:
    closest_name = actual_name = webcolors.rgb_to_name(requested_colour)
except ValueError:
    closest_name = closest_colour(requested_colour)
    actual_name = None
return actual_name, closest_name
def calculate_new_size(image):
if image.width >= image.height:
    wperc = (WIDTH / float(image.width))
    hsize = int((float(image.height) * float(wperc)))
    new_width, new_height = WIDTH, hsize
else:
    hperc = (HEIGHT / float(image.height))
    wsize = int((float(image.width) * float(hperc)))
    new_width, new_height = wsize, HEIGHT
return new_width, new_height
def rgb_to_hex(rgb):
hex = color.to_hex([int(rgb[0]) / 255, int(rgb[1]) / 255, int(rgb[2]) / 255])
print(hex)

return hex
def findColorName(rgb):
aname, cname = get_colour_name((int(rgb[0]), int(rgb[1]), int(rgb[2])))
hex = color.to_hex([int(rgb[0]) / 255, int(rgb[1]) / 255, int(rgb[2]) / 255])
if aname is None:
    name = cname
else:
    name = aname
return hex, name
def TrainKMeans(img):
new_width, new_height = calculate_new_size(img)
image = img.resize((new_width, new_height), Image.ANTIALIAS)
img_array = np.array(image)
img_vector = img_array.reshape((img_array.shape[0] * img_array.shape[1], 3))
print("IMG VECTOR ", img_vector)
kmeans = KMeans(n_clusters=CLUSTERS, random_state=0)
labels = kmeans.fit_predict(img_vector)

hex_colors = [rgb_to_hex(center) for center in kmeans.cluster_centers_]
color_name = {}
for c in kmeans.cluster_centers_:
    h, name = findColorName(c)
    color_name[h] = name

img_cor = [[*x] for x in img_vector]

cluster_map = pd.DataFrame()
cluster_map['position'] = img_cor
cluster_map['cluster'] = kmeans.labels_
cluster_map['x'] = [x[0] for x in cluster_map['position']]
cluster_map['y'] = [x[1] for x in cluster_map['position']]
cluster_map['z'] = [x[2] for x in cluster_map['position']]
cluster_map['color'] = [hex_colors[x] for x in cluster_map['cluster']]
cluster_map['color_name'] = [color_name[x] for x in cluster_map['color']]
print(cluster_map)
return cluster_map, kmeans
def plotColorClusters(img):
cluster_map, kmeans = TrainKMeans(img)
fig = plt.figure()
ax = Axes3D(fig)
# grouping the data by color hex code and color name to find the total count of
# pixels (data points) in a particular cluster
mydf = cluster_map.groupby(['color', 'color_name']).agg({'position': 'count'}).reset_index().rename(
    columns={"position": "count"})
mydf['Percentage'] = round((mydf['count'] / mydf['count'].sum()) * 100, 1)
print(mydf)

# Plotting a scatter plot for all the clusters and their respective colors
ax.scatter(cluster_map['x'], cluster_map['y'], cluster_map['z'], color=cluster_map['color'])
plt.show()

plt.figure(figsize=(14, 8))
plt.subplot(221)
plt.imshow(img)
plt.axis('off')

plt.subplot(222)
plt.pie(mydf['count'], labels=mydf['color_name'], colors=mydf['color'], autopct='%1.1f%%', startangle=90)
plt.axis('equal')
plt.show()
def main():
img = Image.open(IMG_PATH)
plotColorClusters(img)
if name == 'main':
main()
运行结果及报错内容